#
Tag: dashboard
See all tags.
Application • Integrations
Dashboard
To get an overview of how everything is progressing, it is necessary to evaluate quality and flow on a near constant basis.
Application
Generate reports
Leading a business is difficult, and it gets worse as it grows.
Endpoints
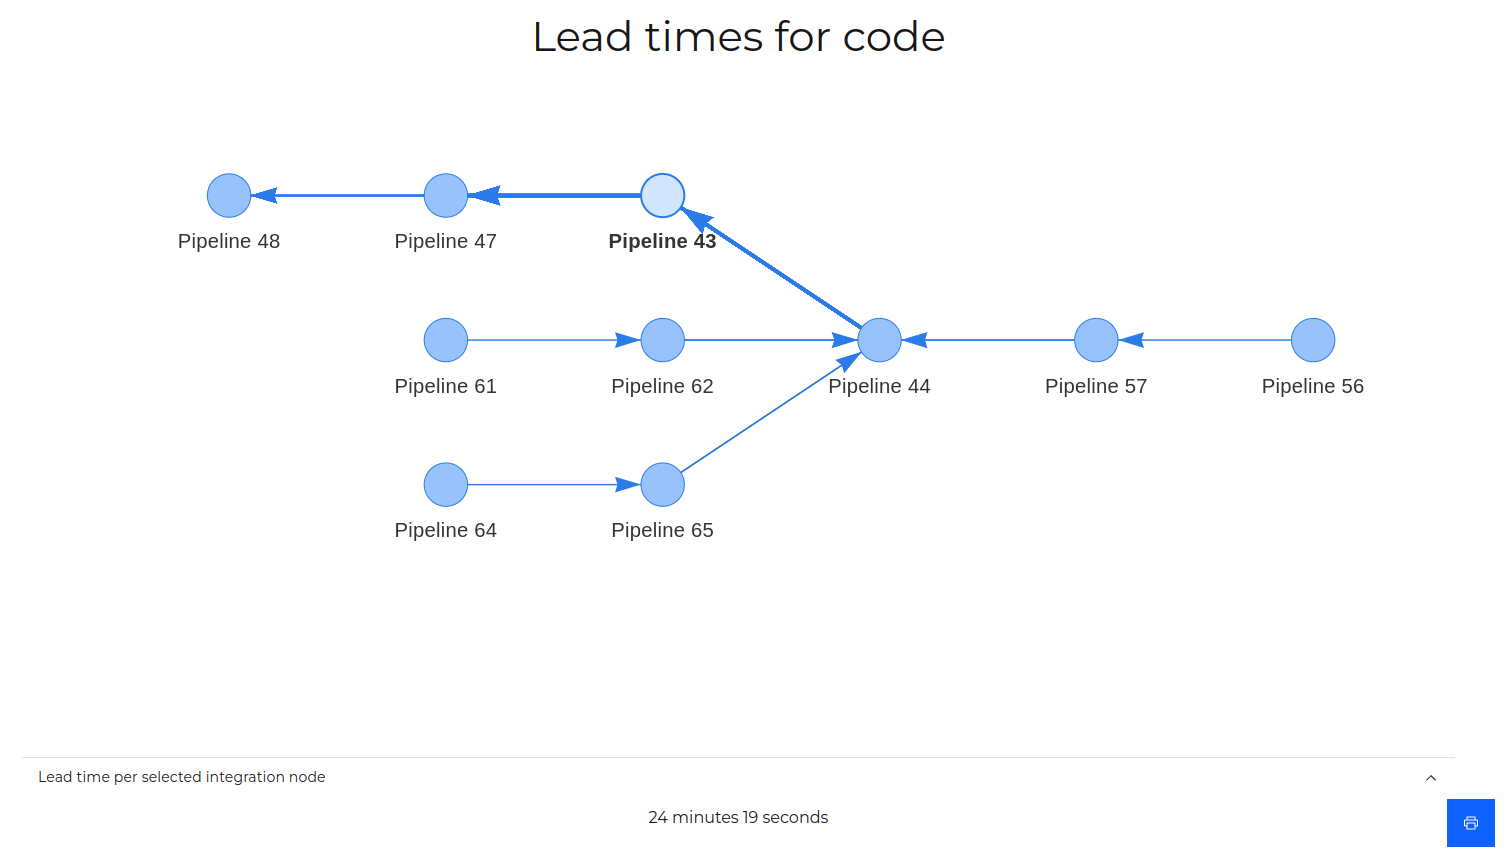
Lead times
Lead times is the first thing you see when you go to the dashboard, and represents the time it takes for your organization to deliver value to your...
Endpoints
Cycle time averages
This is an aggregate average of cycle times, which gives you insight into the overall trend of your project.
Endpoints
Failure time averages
This is an aggregate average of failure times, which gives you insight into the overall trend of your project.
Endpoints
Repair time averages
This is an aggregate average of repair times, which gives you insight into the overall trend of your project.