#
What metrics and why?
Common for all the metrics, is that if you focus on gaming AccidentalQuality's metrics it will not aid you.
The essential improvement comes from focusing on the root cause of the problem, that explains why a given metric is not performing as it should be.
At the heart of AccidentalQuality is the metrics, but that is just what is provided. This page explains why those exact metrics drive the culture and change that an organization requires to flourish and grow.
As a customer of any software service, you indirectly care about how smoothly the engineering department(s) run. Ask most customers, and they will be clueless about the inner workings of software creation, but they will have strong opinions about:
- How long does it take for new behavior to be delivered?
- Is the service stable?
- Does it solve my problem?
Now, the last question is not something we can help you with. But the first two points are what has taken the attention of the DevOps world since 2014 (take a look at the state of DevOps reports if you are curious)!
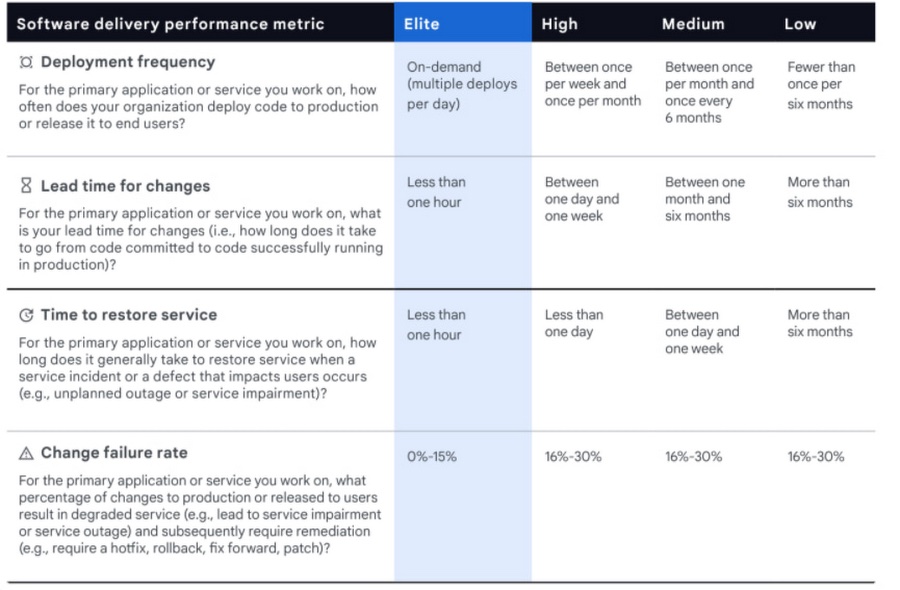
DORA (DevOps research and assessment) scientifically proves that high performing organizations perform well in four key categories:
- Development side:
- Deployment frequency (code reaches customer)
- Lead time (time from commit to customer)
- Operations side:
- Change success rate (code changes that do not introduce regressions or failing behavior)
- MTTR - Mean time to recovery (the time it takes to correct a bug or outage)
At the core, every metric that is processed and gathered helps focus on an aspect or area that feeds into these categories.
A quick peek at one of DORA's initial reports (2015), places companies in the categories as follows:
#
Deployment frequency
Stating the obvious - software is worthless until someone can use it and benefits from it. As a result deployment frequency matters, because every deployment should give your customers value.
In this category you find:
Release pipelines (deployment frequency) Succesful pipeline runs
Deployment frequency can be thought of as a direct software metric for business value.
#
Release pipelines
The pipeline integration that you mark as a release, will automatically track deployment frequency for a given project.
Here the value and goal is transparency around how often customers get value from your software product(s).
#
Succesful/failed pipeline runs
Tracking how often pipelines fail lets you find where work tends to clump together, indicating the existance of a bottleneck.
Here the value is understanding where your deliveries are held back.
#
Lead time
Optimizing lead time (the time a commit takes to production) leads to faster return on investment and opportunities that otherwise cannot be met at the time of a deadline. For example, a website for black friday doesn't do much if deployed after black friday.
In this category you find:
Lead time overview Pipeline run times (cycle times) Pipeline failure time(time to feedback
Lead time can be thought of as a direct software metric for risk mitigation and predictability.
#
Lead time overview
At the heart of AccidentalQuality is flow. Flow enables quality, it enables speed, and it enables feedback. After you set up how your pipelines connect on the dashboard you get an almost immediate understanding of your bottleneck(s) in terms of flow.
To simplify lead times, and avoid outliers changing the perspective from view to another, we use the average run times for your pipelines to calculate lead times.
Below is an example of lead times:
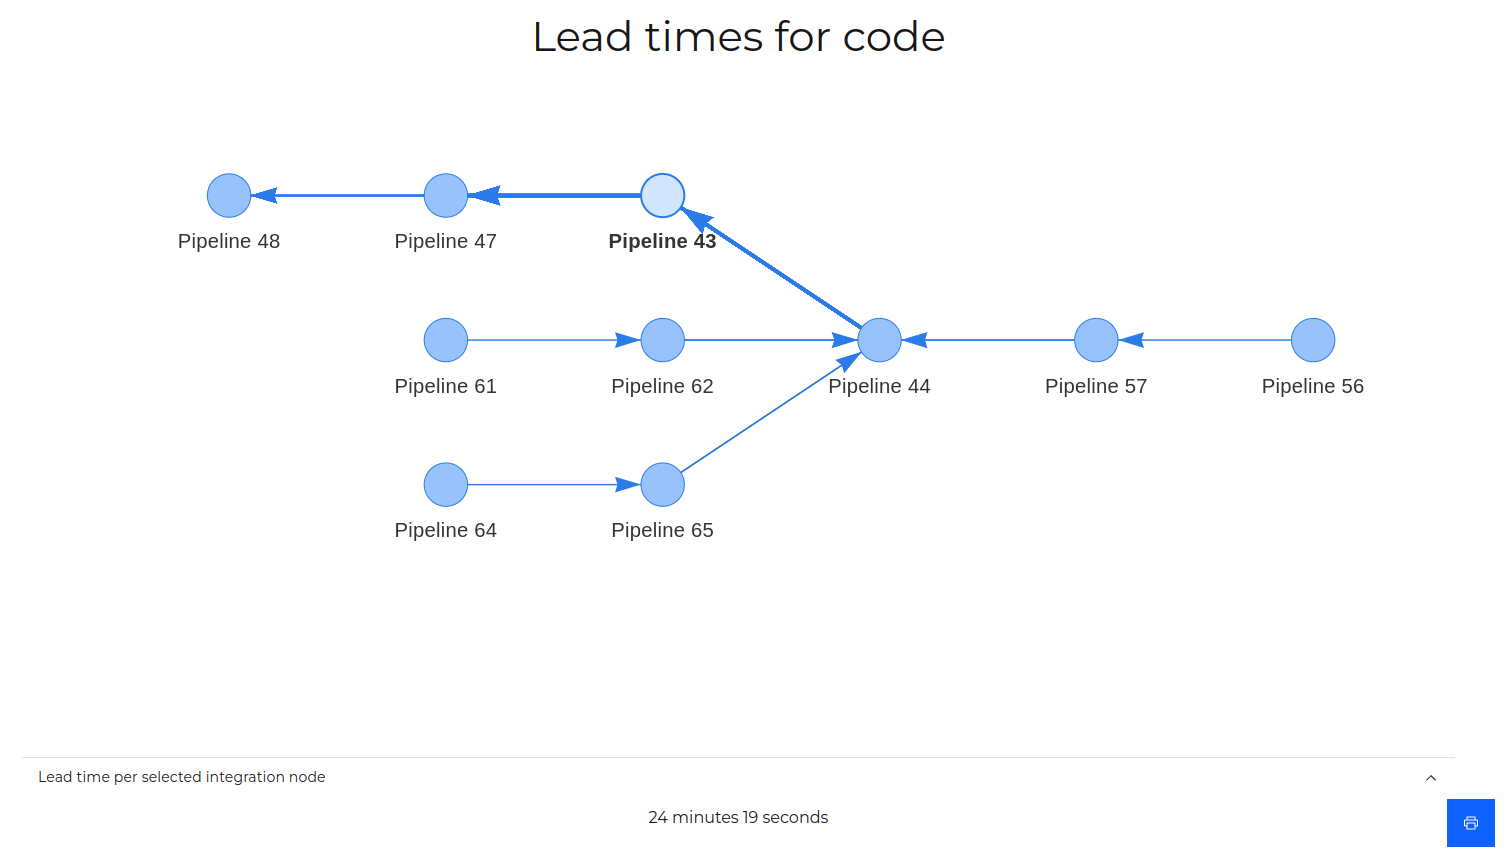
Here the value is understanding where you can improve your flow, increasing predictability.
#
Pipeline run times
The time it takes to run a pipeline is sometimes referred to as 'cycle time', and the interesting perspective is to look at historical data for how the runtime shapes up over a longer period.
Over time this allows you to keep an eye on when it's time for infrastructural improvements, which if left undone will cause your system to rust and slow down significantly.
Here the value is proactively staying ahead of slowdowns.
#
Pipeline failure time
When programming, one of the most common causes for lost productivity is context switching - working on one thing, and having to unlearn what you know to learn another thing and then work on that instead.
Keeping context allows developers to keep an eye out for details, which get lost when having to remember "where was I?".
If the time it takes pipelines is high, what often happens is that people do not wait for it to finish, but instead move on to other work - only to be forced back to the original issue when the pipeline eventually fails.
Failing fast allows people to stay within context, and ultimately produces happier and more productive engineers.
Here the value is earlier feedback, allowing you to make better micro decisions which add up over time.
#
Change success rate
Change success rate tells you how much time is spent on rework, dealing with the consequences of missed issues and incorrect decisions as well as poor quality levels.
Paying close attention to this category, will lead to a compounding effect where less time is wasted across the board.
In this category you find:
Bug counts
#
Bug count
Bug count is maybe the most traditional quality metric, and for good reason. Quantifying problems your users face, gives you a very good idea of your general quality level, as well as an indicator of where you need to invest more time in automation and testing.
There is no such thing as bug free software, but keeping your software relatively bug free reduces the friction your customers have on a daily basis and leads to much happier customers, which in turn keeps them loyal.
The value here is to look for the trend in bug count, to access quality priorities vs features and other categories of work.
#
Mean time to recovery
Mean time to recovery is better known as the time that your customers are unhappy with you. Your abillity to resolve challenges as they appear leads to lower turnover and consistency in your operations.
In this category you find:
Blocker and critical bugs Pipeline recovery times Bug recovery
Mean time to recovery can be thought of as a direct software metric for risk mitigation and quality.
#
Bug recovery
Bug recovery is the average time that your customers spend waiting for a patch to a problem they have reported. Most companies end up in a situation, where old bugs plague their codebase and customers rely on them and thus cannot be patched.
Having a quick turnaround time for bug patches leads to immense customer satisfaction and has the hidden bonus of making a bug cheaper, since the more time that passes the more likely it is that the original engineer has moved on, or that code has been added around the bug making it harder to fix without regressions and other things needing patching as well.
The value in a quick bug recovery is overall higher quality levels, and more satisfied customers.
#
Bug outages (blocker and critical bugs)
Bug outages are the term used to look at blocker and critical bugs over time. In AccidentalQuality it is represented as a heat map (see below) and describes days where a critical or blocker bug was open.
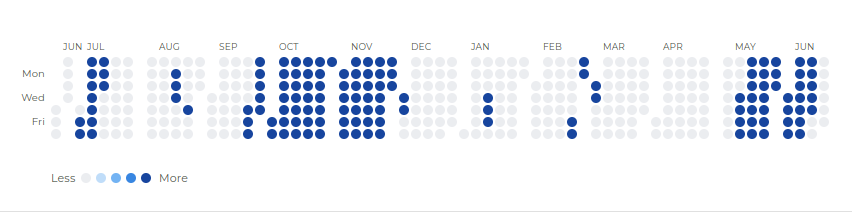
The cultural change it seeks to accomplish, is that blocker and critical bugs should take precedence over other types of work. Bugs grow more expensive over time, in both customer patience but also technically as more code and complexity is added on top.
The value provided here is an overview of operational excellence around bugs and prioritization.
#
Pipeline recovery times
Pipelines are only valuable if they are providing feedback that developers can immediately put to use. Pipelines that fail, and are ignored by development incur a hidden cost which grows exponentially, where problems grow due to neglect.
Failing to address broken pipelines will eventually lead to one, if not multiple, developers having to babysit builds to get code passing.
Pipeline recovery times seeks to address this cultural problem and stop it dead in its tracks. It is highly recommended setting a target below a workday, ideally at around an hour or below, so that pipelines are not left in a broken state.

The provided value is a change or consistency in culture, so pipelines take priority over all work. Over time it leads to higher quality and better flow.