#
Dashboard
To get an overview of how everything is progressing, it is necessary to evaluate quality and flow on a near constant basis. This allows you to define new goals and access if the coming period needs to increase flow through pipeline and infrastructural maintenance or clamp down on quality through bug hunts, better test suites or an increase in focus on quality.
For every project set up in AccidentalQuality, the dashboard aggregates useful data and gives an overview of averages, lead times and quality levels across that project. As long as integrations are setup, the dashboard will follow along with the data flow and give a quick overview of where to invest development time.
#
Lead times
Lead times is one of the primary metrics to see flow through an organization, and allows you to narrow down bottlenecks with precision and tune your delivery speeds to new levels.
After
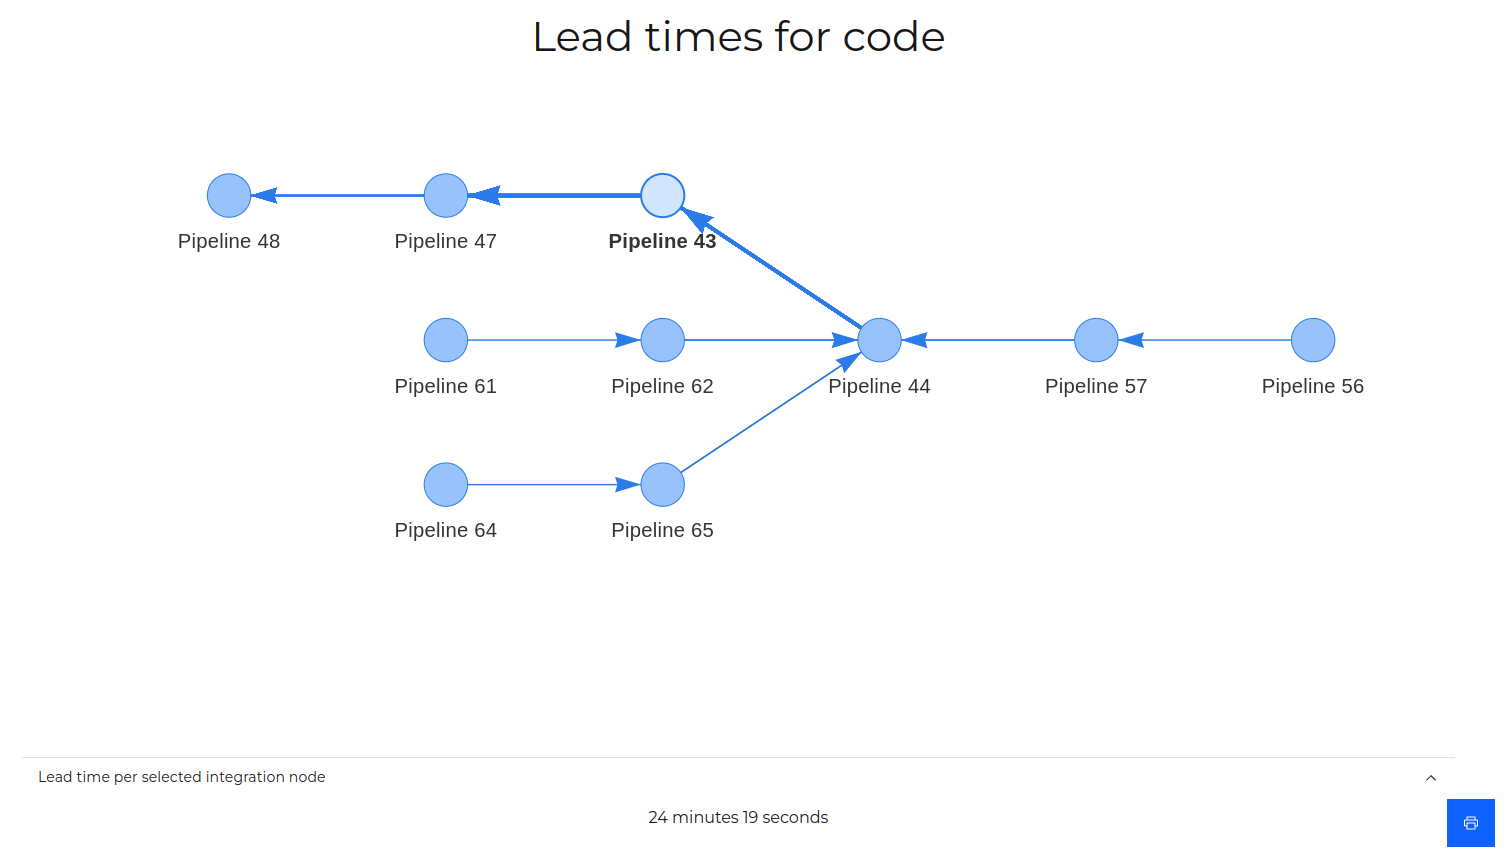
Above is an example of how lead times can look.
#
Setting up lead times
To get an accurate lead time perspective, it is necessary to know how your pipelines feed into one another.
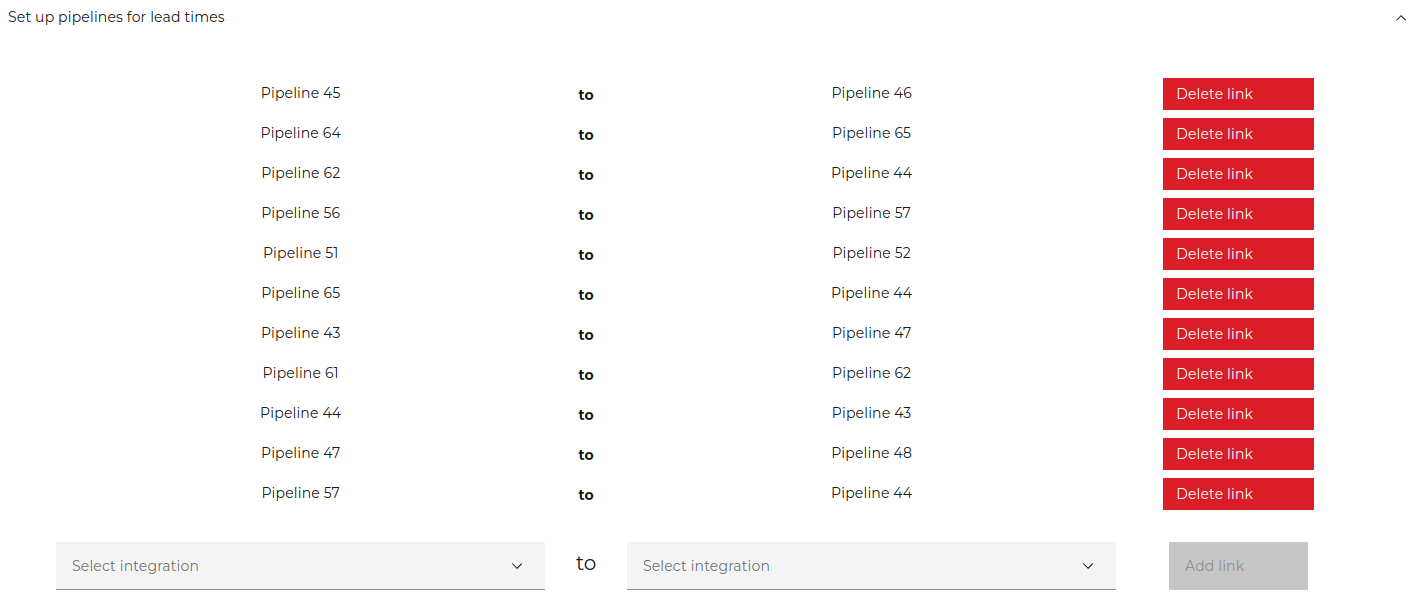
After configuring the links, the data needs to be processed - which takes a moment - after which you can see your lead time for any given part of your software deliveries.